Evidence study
Arithmetic or geometric? 1,771 weighting runs on one fictional decision
A reproducible sensitivity study shows where two aggregation methods agree, disagree, and depend on assumptions about a one-to-five score scale.
A weighted total can look decisive while depending on a choice made before any weights are entered: how should the scores be combined? This study holds three fictional meetup options and their four criterion scores fixed, then compares an arithmetic weighted mean with a geometric weighted mean across every nonnegative five-point weight combination that sums to 100.
The deterministic run covers 1,771 weight combinations. Both methods select the same single leader in 1,576 runs. They select different single leaders in 144 runs, while 51 runs contain a tie under at least one method. Those counts describe this constructed score table and grid; they are not estimates of real preferences or outcomes.
Ask one bounded question
The question is: how often do the two methods select different leaders when the same four weights vary across their full five-point grid? The decision is the fictional club choice already documented in the Idea Comparison Board: indoor discussion scores 5, 4, 5, 2; neighborhood photo walk scores 4, 5, 1, 5; postcard workshop scores 2, 3, 5, 4. The columns are conversation, low preparation, weather resilience, and novelty.
Scores stay fixed. The script enumerates weights from 0 through 100 in steps of five, retaining only four-value combinations whose sum is 100. This creates 1,771 unique runs, including corner cases where one criterion receives all the weight. The order is deterministic: conversation, preparation, weather, then novelty.
Run both formulas on identical inputs
The arithmetic method calculates sum(score × weight / 100). It is compensatory: a high score can offset a low one. The geometric method calculates exp(sum((weight / 100) × ln(score))). It penalizes low scores more strongly. Every score is greater than zero, so each logarithm is defined.
For each method, the option with the largest calculated value is the leader. Values equal within 0.0000000001 are recorded as a tie. Published files round displayed method scores to six decimal places, while winner selection uses the unrounded calculation. The source script, raw records, and tests provide independent ways to repeat the result.
Government decision-analysis guidance describes weighted sums and sensitivity analysis as aids whose judgments and uncertainty should remain visible. This study uses that transparency principle; it does not claim that either formula is universally correct.
Sources: Government Analysis Function: An Introductory Guide to MCDA, NASA: Decision Analysis
Compare the 1,771 outcomes
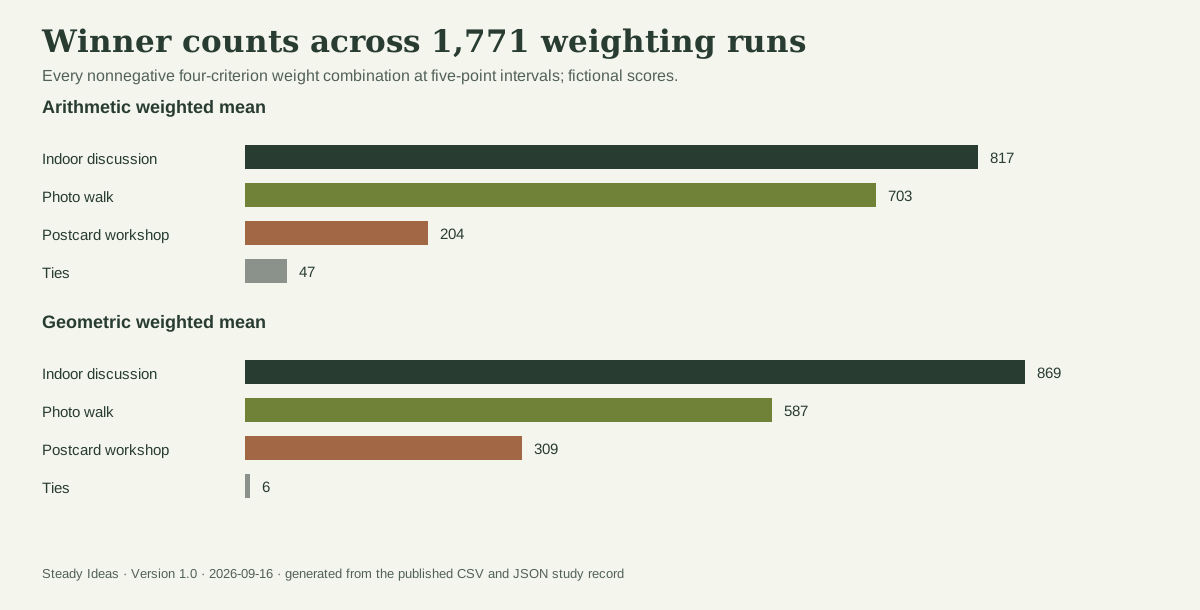
The indoor discussion leads most often under both methods: 817 arithmetic runs and 869 geometric runs. The photo walk leads in 703 arithmetic runs and 587 geometric runs. The postcard workshop leads in 204 arithmetic runs and 309 geometric runs. The arithmetic method records 47 ties; the geometric method records six.
A run-by-run comparison finds 1,576 cases with the same single winner and 144 with different single winners. Another 51 runs contain at least one tie. The disagreement count matters because no score or weight changed between methods. The aggregation rule alone changed the leading option in those 144 cases.
| Outcome | Arithmetic weighted mean | Geometric weighted mean |
|---|---|---|
| Indoor discussion | 817 | 869 |
| Neighborhood photo walk | 703 | 587 |
| Postcard workshop | 204 | 309 |
| Tie | 47 | 6 |
Inspect and repeat the runs
Download the complete JSON record for the question, fixed inputs, formulas, limitations, summary, version history, hashes, and every run. Download the complete CSV table for one row per weight combination with both methods' scores and winners.
Dataset reuse: the original generated run data in those JSON and CSV files is dedicated to the public domain under CC0 1.0. That dedication does not cover linked third-party source material, names or marks, the Steady Ideas site design, or the article prose and chart presentation.
The generator is scripts/generate-method-study.mjs in the publication source. Running npm run generate:evidence recreates both data files and the chart from declared constants. Tests separately assert the number of combinations, the published leader counts, the agreement counts, and selected corner calculations.
To explore one set of priorities rather than the full grid, open the Idea Comparison Board. To examine a single weight change, use Would one weight change your choice?.
Keep the limitations beside the result
The score table and decision context are fictional. Winner counts do not estimate human preferences, meeting quality, or the chance of success. Giving every five-point weight combination one run is a coverage choice, not a probability distribution over how people value the criteria.
The one-to-five scales were constructed as approximate preference intervals. Multiplying them assumes meaningful score ratios that these definitions do not establish. The geometric model is therefore a stress test of a different aggregation rule, not a recommendation to use geometric means on ordinary rating scales.
The study holds scores fixed and tests model sensitivity only. Evidence uncertainty, threshold requirements, correlated criteria, missing criteria, and alternative score scales could all change the result. Use option screening before relying on a compensatory total.
Version and corrections
Version 1.0 was published September 16, 2026. It defines the fictional inputs, enumerates 1,771 weight combinations, publishes both formulas, and includes JSON, CSV, and an SVG chart.
Corrections: none as of September 16, 2026. A material correction will keep the original publication date, advance the updated date, describe the changed calculation or claim here, and increment the dataset version. Routine rebuilds do not change those dates.
Cite this resource
Suggested citation: Awesome Patel. “Arithmetic or geometric? 1,771 weighting runs on one fictional decision.” Steady Ideas, version 1.0, September 16, 2026. https://steadyideas.com/guides/arithmetic-geometric-weight-sensitivity.
The publisher is Awesome Patel in Chicago. Steady Ideas is controlled by its publisher; citation identifies the source and does not make it independent validation. See the editorial standards for correction and AI-assistance practices.